Wealthtender is a trusted, independent financial directory and educational resource governed by our strict Editorial Policy, Integrity Standards, and Terms of Use. While we receive compensation from featured professionals (a natural conflict of interest), we always operate with integrity and transparency to earn your trust. Wealthtender is not a client of these providers. ➡️ Find a Local Advisor | 🎯 Find a Specialist Advisor

It’s complicated….
“Americans owe a record $1.1 trillion in credit card debt, straining budgets” announces CBS.
“Americans Are Carrying Record Household Debt into 2024” decries MarketWatch.
Anywhere you look, you see these and other sensationalist headlines, each seeming to try and outdo the others in its gloom and doom.
Debt Is a Real Problem
There’s no question that debt is a real problem for American families.
This is even more true when interest rates are so much higher than they were as recently as two years ago.
This is very likely the reason for the huge disconnect between consumer sentiment on the one hand and lower inflation and continued strong employment numbers on the other. This disconnect is so sharp that economists call it “the consumer sentiment anomaly.”
That’s the case made in a paper published by the National Bureau of Economic Research (NBER), by former Treasury Secretary Larry Summers and co-authors, titled “The Cost of Money is Part of the Cost of Living: New Evidence on the Consumer Sentiment Anomaly.”
If you’re in debt and interest rates go up, a larger portion of your paycheck likely goes to cover your interest costs, leaving fewer dollars to cover current needs.
Are We Really at Maximum Debt?
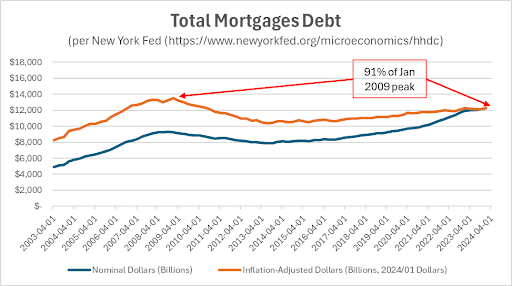
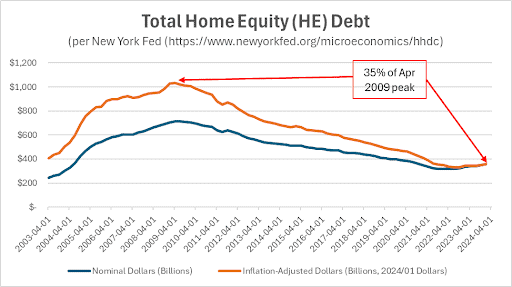
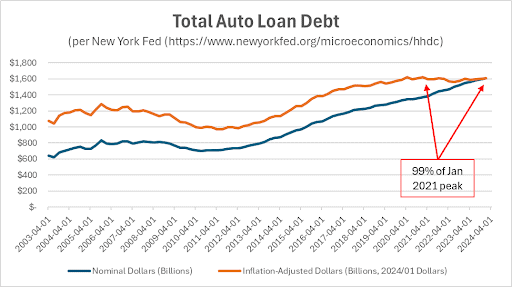
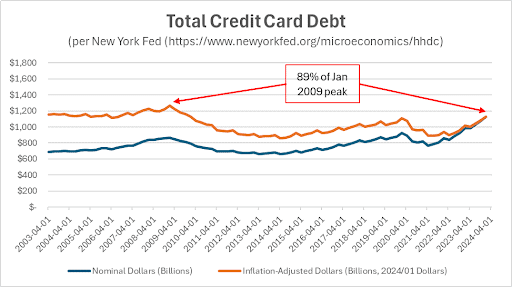
If you look at debt levels in nominal dollars (i.e., not adjusted for inflation), almost every type of consumer debt is at, or very near to its peak, as is total consumer debt.
The thing is, that’s a misleading picture.
Can we really compare a billion dollars worth of debt today to a billion dollars of debt back in 2003, when the dollar was worth about 70% more?
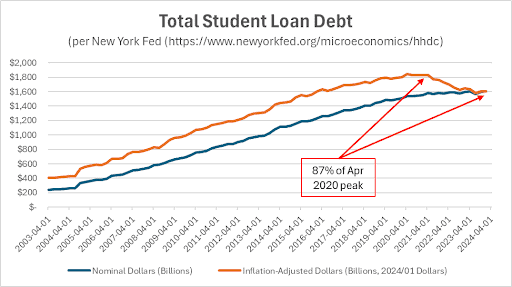
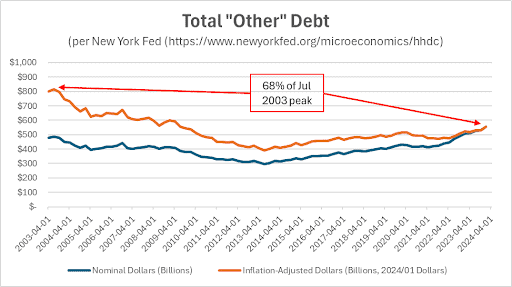
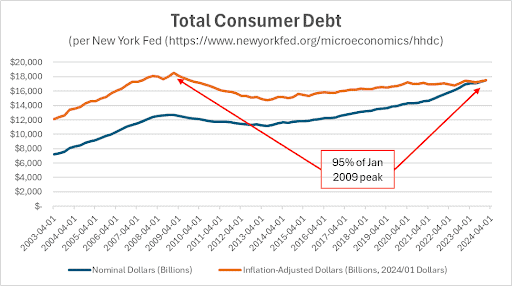
To get a clearer picture, we need to adjust those debt levels to account for inflation over time.
The following seven graphs do exactly that, and the picture is surprising.
The Bottom Line
Looking in terms of 2024 dollars, our debt levels aren’t the highest they’ve ever been. Indeed, in every category of debt, as well as in their total, things aren’t as bad now as they’ve been in the past.
- Mortgage debt is 9% lower than its Jan 2009 peak.
- Home equity debt is 65% below its Apr 2009 peak.
- Auto loan debt, while close, is still 1% below its Jan 2021 peak.
- Credit card debt is 11% below its Jan 2009 peak.
- Student loan debt is 13% below its Apr 2020 peak.
- So-called “other” debt is 32% below its Jul 2003 peak.
- Finally, and most importantly, total consumer debt is 5% below its Jan 2009 peak.
So, yes, things are bad, but in real terms, we’ve been through worse.
Having said that, as Michael Hunsberger, ChFC®, Owner of Next Mission Financial Planning, LLC, points out, “While these debt categories aren’t at their peak, they have started to rise again, a reversal from the down-to-flat trend since the Global Financial Crisis of 2007/08. The key factor in whether these levels are sustainable is the job market. If that weakens, more people could struggle to pay off their debts, especially credit cards and auto loans.”
Alison Roth, Financial Advisor at AdvicePeriod, agrees, saying, “Our current debt levels aren’t at their peak, but they aren’t far from it and may be flashing warning signs for the economy. For example, rolling 30-year averages of the national personal savings rate have never dipped below 5.8% of personal disposable income. Since early 2022, figures have come in below that average, with the most recent figure at 3.8%. This doesn’t necessarily mean impending economic doom as the media seem to say, but it may be an indicator that the consumer is feeling financial stress and current levels of debt and spending may be unsustainable. This is especially so with government stimulus tapering off, relatively high interest rates, and the restart of student loan repayments.”
Disclaimer: This article is intended for informational purposes only, and should not be considered financial advice. You should consult a financial professional before making any major financial decisions.

About the Author
Opher Ganel, Ph.D.
My career has had many unpredictable twists and turns. A MSc in theoretical physics, PhD in experimental high-energy physics, postdoc in particle detector R&D, research position in experimental cosmic-ray physics (including a couple of visits to Antarctica), a brief stint at a small engineering services company supporting NASA, followed by starting my own small consulting practice supporting NASA projects and programs. Along the way, I started other micro businesses and helped my wife start and grow her own Marriage and Family Therapy practice. Now, I use all these experiences to also offer financial strategy services to help independent professionals achieve their personal and business finance goals. Connect with me on my own site: OpherGanel.com and/or follow my Medium publication: medium.com/financial-strategy/.
Learn More About Opher
Wealthtender is a trusted, independent financial directory and educational resource governed by our strict Editorial Policy, Integrity Standards, and Terms of Use. While we receive compensation from featured professionals (a natural conflict of interest), we always operate with integrity and transparency to earn your trust. Wealthtender is not a client of these providers. ➡️ Find a Local Advisor | 🎯 Find a Specialist Advisor

