
Wealthtender is a trusted, independent financial directory and educational resource governed by our strict Editorial Policy, Integrity Standards, and Terms of Use. While we receive compensation from featured professionals (a natural conflict of interest), we always operate with integrity and transparency to earn your trust. Wealthtender is not a client of these providers. ➡️ Find a Local Advisor | 🎯 Find a Specialist Advisor

Seven months ago, I quoted Warren Buffet’s famous advice:
“A low-cost fund is the most sensible equity investment for the great majority of investors. My mentor, Ben Graham, took this position many years ago, and everything I have seen since convinces me of its truth.”
I then wrote, “I’d be the last to argue that if you don’t know the first thing about investing, you could do far worse than following Warren Buffet’s advice.
However, if you’re willing to educate yourself a bit about picking well-run active mutual funds, your long-term results may well leave those index-fund investors in the proverbial dust, and leave you with a far sweeter retirement.”
Recently, Ben Le Fort wrote, “Are You Smarter than a 5th Grader? Not If You Invest in [Active] Mutual funds,” citing research that claims 82.5% of actively managed funds in the US underperformed the S&P 500 over a 10-year period.
I responded, “If over the past 10 years, 82.5% of actively managed funds in the US underperformed the S&P 500 when accounting for investment fees, that means 17.5% of active funds outperformed the index. This means that if you can figure out a way to pick the 1 in 6 out-performing funds, you can leave index investors in your financial rear-view mirror.”
I then shared that over the past couple of decades, that’s exactly what I’ve done, outperforming the S&P 500 by about 1%/year, which resulted in my portfolio growing over 20% faster than it would have had I followed Buffet’s (and Le Fort’s) advice.
Andrew Plummer then weighed in, saying, “…fund performance is very likely non-stationary, meaning that the previous ten-year average is likely to not be repeated in the subsequent ten years.
What this means is that active investors that had to pick that 1 in 6 funds which beat the market over the previous ten years may need to pick the 1 in 10 (or 1 in 100) funds that beat the market in the next ten years.
Therefore, the question is: should we expect more funds to beat the market over the next ten years, or less? I’d argue for the latter, but would love your honest views on this…”
Challenge Accepted!
Since I can’t fast-forward 10 years to see if my picks still out-perform index funds, I had to do something different.
To avoid claims of my skewing the results by choosing a different set of funds, I’ll work with the same 8 funds I mentioned in my previous article.
- T. Rowe Price Value (TRVLX)
- T. Rowe Price International Discovery (PRIDX)
- T. Rowe Price Capital Appreciation (PRWCX)
- T. Rowe Price QM US Small-Cap Gr Eq (PRDSX)
- T. Rowe Price New Horizons (PRNHX)
- T. Rowe Price Health Sciences (PRHSX)
- T. Rowe Price Comm & Tech Investor (PRMTX)
- T. Rowe Price Global Technology (PRGTX)
I looked at their performance during three consecutive 5-year periods, from 15 to 10 years ago, from 10 to 5 years ago, and over the past 5 years.
Then, I compared those to the same 12 Vanguard index funds mentioned in my previous article.
- Vanguard International Value Inv VTRIX
- Vanguard Developed Markets Index Admiral VTMGX
- Vanguard Total Intl Stock Index Inv VGTSX
- Vanguard Emerging Mkts Stock Idx Inv VEIEX
- Vanguard Real Estate Index Investor VGSIX
- Vanguard Value Index Inv VIVAX
- Vanguard Balanced Index Inv VBINX
- Vanguard Value Index I VIVIX
- Vanguard Small Cap Value Index Inv VISVX
- Vanguard 500 Index Investor (VFINX)
- Vanguard Small Cap Index Inv NAESX
- Vanguard Small Cap Growth Index Inv VISGX
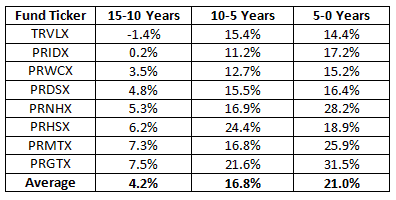
The Results for 8 T. Rowe Price Active Funds
The following table shows the annualized performance numbers for the 8 active T. Rowe Price funds over three consecutive 5-year periods, based on Morningstar data.
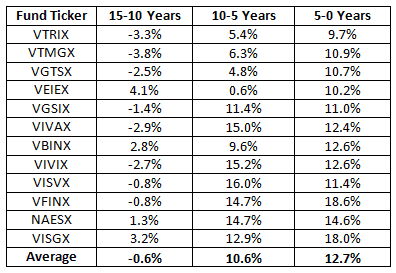
The Results for 12 Vanguard Index Funds
The following table shows the annualized performance numbers for the 12 Vanguard funds over the same three 5-year periods, again, based on Morningstar data.
Comparing the Results
From 15 Years Ago to 10 Years Ago
In the first 5-year period, only 1 of the 8 active funds (12.5%) lost money, while 8 of the 12 Vanguard index funds (66.7%) lost money.
The worst performer of the active funds lost an annualized 1.4%, while the best gained an annualized 7.5%. The index funds’ worst performer lost an annualized 3.8%, while the best gained an annualized 4.1%.
The average performance of the active funds during those years was an annual gain of 4.2% vs. an annualized average loss of 0.6% for the index funds.
Conclusion: Active funds did better in terms of worst, average, and best performance
From 10 Years Ago to 5 Years Ago
For the second 5-year period, none of the active funds or index funds lost money.
The worst-performing active funds gained an annualized 11.2%, while the best gained an annualized 24.4%. For the index funds, the worst was nearly flat at a positive 0.6%, while the best gained 16.0%.
The active fund average was up an annualized 16.8%, vs. an annualized gain of 10.6% for the index funds.
Conclusion: Active funds again did better in terms of worst, average, and best performance
From 5 Years Ago to Now
For the most recent 5-year period, again, none of the active or index funds lost money.
The active funds’ worst and best performers gained 14.4% and 31.5%, respectively. That compares with 9.7% and 18.6% for the index funds’ worst and best performers, respectively.
The annualized average for the active funds was 21.0% vs. 12.7% for the index funds.
Conclusion: Active funds yet again did better in terms of worst, average, and best performance
The Bottom Line
In short, comparing the 8 active T. Rowe Price funds to the 12 Vanguard index funds showed the former beat the latter in each of the 5-year periods in terms of worst-, average, and best-performing funds.
Had you invested $10,000 15 years ago in an equally weighted portfolio of the 8 active funds, you’d have had $12,261 after 5 years. Had you invested the same $10,000 in an equally weighted portfolio of the index funds, it would have lost money, ending at $9722 after 5 years.
Had you repeated this exercise 10 years ago for a 5-year period, you’d have ended with $21,768 from the active funds vs. only $16,516 from the index funds.
Repeating it once again 5 years ago, your active funds’ $10,000 would have grown to $25,889 vs. just $18,198 from the index funds.
Enough said?
Disclaimer: The above is intended for informational purposes only and does not constitute financial or investing advice. You should conduct your own due diligence and/or consult an investment advisor before investing. None of the above is intended to endorse any specific fund or fund family. Past performance does not guarantee future results.
Disclaimer: This article is intended for informational purposes only, and should not be considered financial advice. You should consult a financial professional before making any major financial decisions.

About the Author
Opher Ganel, Ph.D.
My career has had many unpredictable twists and turns. A MSc in theoretical physics, PhD in experimental high-energy physics, postdoc in particle detector R&D, research position in experimental cosmic-ray physics (including a couple of visits to Antarctica), a brief stint at a small engineering services company supporting NASA, followed by starting my own small consulting practice supporting NASA projects and programs. Along the way, I started other micro businesses and helped my wife start and grow her own Marriage and Family Therapy practice. Now, I use all these experiences to also offer financial strategy services to help independent professionals achieve their personal and business finance goals. Connect with me on my own site: OpherGanel.com and/or follow my Medium publication: medium.com/financial-strategy/.
Learn More About Opher
Wealthtender is a trusted, independent financial directory and educational resource governed by our strict Editorial Policy, Integrity Standards, and Terms of Use. While we receive compensation from featured professionals (a natural conflict of interest), we always operate with integrity and transparency to earn your trust. Wealthtender is not a client of these providers. ➡️ Find a Local Advisor | 🎯 Find a Specialist Advisor