Wealthtender is a trusted, independent financial directory and educational resource governed by our strict Editorial Policy, Integrity Standards, and Terms of Use. While we receive compensation from featured professionals (a natural conflict of interest), we always operate with integrity and transparency to earn your trust. Wealthtender is not a client of these providers. ➡️ Find a Local Advisor | 🎯 Find a Specialist Advisor

A big difference between exchange-traded funds (ETFs) and mutual funds is the ability to trade in the ETF intraday on the exchange.
Investors can see an indicative price for the fund at any point during the trading day and purchase or sell the fund just like they would a stock, using margin, limit orders etc.
This is compared to mutual fund investors who can only sell or buy fund shares or units at 4 pm ET on market close and at a price that they will not know until after the fact, once the net asset value, or NAV, is “struck”.
However, the advantage cited there is that mutual fund investors get the exact NAV of the fund as opposed to ETF investors making the transaction at an “indicative price” that could be at a premium or discount to the actual fund’s NAV.
In general, ETF shares will trade at a premium to NAV when demand is high and at a discount to NAV when demand is low.
There is a mechanism that exists which is intended to keep the ETF’s price close to NAV. The designated broker to the fund has the ability to arbitrage between ETF price and the fund NAV and creating a profit for themselves.
They do this by creating or redeeming ETF shares from the fund company, in exchange for the underlying basket of securities that the broker can buy from or sell to the open market.
However, the broker would only do this if the discrepancy between the ETF price and fund NAV is large enough to compensate them for the transaction charge they pay the fund company when creating or redeeming ETF shares.
As a result, in every ETF, a small premium or discount to the fund NAV will always exist because the designated broker does not have enough incentive to arbitrage that away.

But how small is small when it comes to ETF premiums or discounts to NAV?
When looking at actively-managed ETFs specifically, there have been claims made that active ETFs will tend to have larger premium/discounts to NAV because of greater turnover in the fund and lower interest from market makers and designated brokers etc.
We decided to look at exactly how active ETFs in the US have fared in terms of keeping their ETF prices close to NAV.
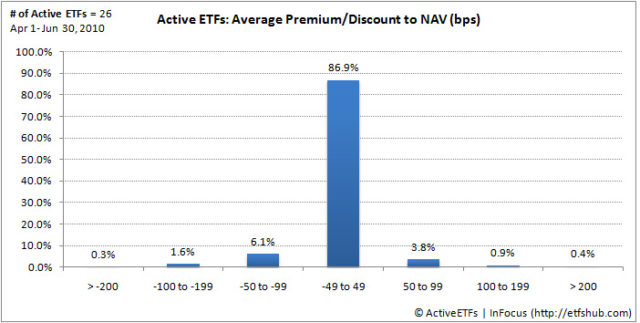
The table below looks at the number of days in Q2 2010 (63 trading days) that each active ETF spent trading premiums or discounts of different magnitudes. And the chart below that shows the average distribution across all 26 actively-managed ETFs that traded in Q2 2010.
The information is compiled from data disclosed on each fund’s websites. The premium / discount is calculated as the % deviation of the ETF’s mid price on market close from the fund NAV.
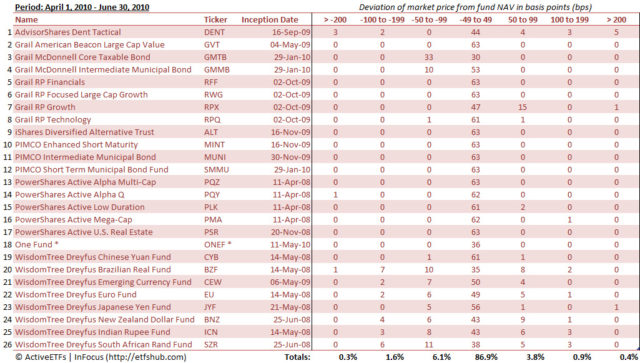
From the table, we can see that most equity focused actively-manged ETFs have not had trouble keeping their ETF prices close to NAV, except maybe AdvisorShares Dent Tactical ETF, that has spent more days trading at large premiums or discounts compared to other equity ETFs.
On the fixed-income side, Grail’s two bond funds have had a tendency to trade at a discount of between 50-99 bps quite a lot. This doesn’t compare well with PIMCO’s bond ETFs that have what you could call a “perfect score” in this context, as none of their funds traded at premiums or discounts greater than 50 bps in Q2.
However, the largest discrepancies are seen from WisdomTree’s currency funds that trade outside of the 50 bps mark with surprising regularity. The most glaring offender would be the Brazilian Real Fund which spent only 35 trading days trading within the tight 50 bps band, and had 8 days where it traded at a discount greater than 100 bps. Clearly, this is something WisdomTree should be looking at.


On average though, looking at active ETFs as a whole, 87% of the time the funds traded within the +/- 50 bps range, with very few occurrences overall where funds traded at large premiums or discounts in excess of 2% or 200 bps.
This is isn’t much different from most traditional index ETFs. As such, active ETF investors don’t need to be overly concerned. It is more important to know in which asset classes you are more likely to encounter larger premiums and discounts than normal and keep a look out for those before investing.

About the Author
Shishir Nigam, CFA, CAIA
Shishir Nigam is a self-professed investing and finance geek with various entrepreneurial interests as well. Wide-ranging investment management experience has given him the knowledge to back his words and insights. Currently, he works full-time at one of the largest commercial real estate asset managers in North America, based out of the beautiful city of Vancouver, BC.
Specialties: Portfolio Management, Fund Administration, Commercial Real Estate, Trading, Investing, Performance Reporting & Attribution, GIPS, Composite Management, Active ETFs, Writing
Wealthtender is a trusted, independent financial directory and educational resource governed by our strict Editorial Policy, Integrity Standards, and Terms of Use. While we receive compensation from featured professionals (a natural conflict of interest), we always operate with integrity and transparency to earn your trust. Wealthtender is not a client of these providers. ➡️ Find a Local Advisor | 🎯 Find a Specialist Advisor