
Wealthtender is a trusted, independent financial directory and educational resource governed by our strict Editorial Policy, Integrity Standards, and Terms of Use. While we receive compensation from featured professionals (a natural conflict of interest), we always operate with integrity and transparency to earn your trust. Wealthtender is not a client of these providers. ➡️ Find a Local Advisor | 🎯 Find a Specialist Advisor

If you’ve been struggling to afford to buy a home, you’re not alone. The housing burden shot up, making it harder to form new households and pushing homebuyers, especially those at lower incomes, to lower-cost locations.
The most recent housing report from Harvard’s Joint Center for Housing Studies, their State of the Nation’s Housing 2023 report, and the Urban Institute’s most recent housing finance report, their Housing Finance at a Glance Monthly Chartbook March 2023, both paint a grim picture, especially for new households.
What the Data Show About Home Prices, Mortgage Rates, and Housing Burden
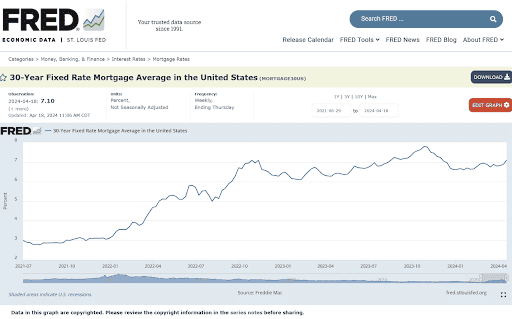
The St. Louis Fed’s 30-Year Fixed Rate Mortgage Average in the United States data show 30-year fixed mortgage rates shooting up from sub-4% in early 2022 to a peak of 7.79% in late October 2023, dropping to 6.60% in January 2024 before increasing again to 7.10% this month, a near-90% increase relative to early 2022!
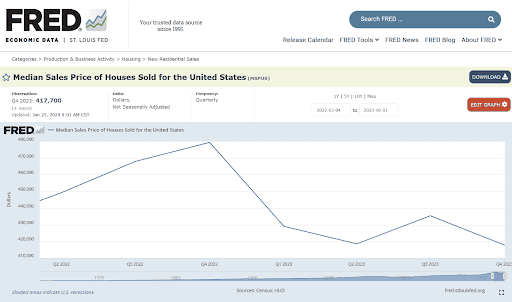
The St. Louis Fed’s Median Sales Price of Houses Sold for the United States data show the median home price in the US rising from $449.3k in the second quarter of 2022 to a peak of $479.5 at the end of 2022 before dropping gradually to $417.7k by the end of 2023, a 7% decline relative to early 2021.
As a result, a homebuyer putting 20% down in early 2022 would have paid principal and interest (P&I) of $1667 a month, while another homebuyer doing the same now would pay $2246 for their P&I, 35% more!
However, according to the Urban Institute, “From May 2023 to January 2024, year-over-year house price appreciation increased each month at all [price] tiers.”
How did income fare during that time?
According to Ycharts, the median family income in the US increased from $86.4k in March 2022 to $100.9k in Feb 2024, a 16.7% increase.
As a result, a median-income family that bought the median-price home in early 2022 would have allocated 23.1% of their income to cover mortgage P&I. A family who bought a median-price home in recent months would have a higher housing burden of 26.7%.
This problem is far worse for low-income families.
According to the Urban Institute study, affordability is now lower than it was even during the 2005 housing bubble, “As of January 2024, with a 20% down payment, the share of median income needed for the monthly mortgage payment stood at 31.6%, higher than the 30.9% at the peak of the housing bubble in November 2005.”
Implications for Household Formation
The Harvard study states, “First-time home¬buying plummeted in the second half of [2022] in response to sharply rising interest rates that have significantly increased the cost of homeownership.”
The study authors continue to say, “Single-family homebuilding declined significantly [in 2022] as buyers reacted to sharply higher borrowing costs. Single-family housing starts dropped 10.8 percent in 2022, with the slowdown growing more pronounced throughout the year. The annualized rate of single-family housing starts… [was] down 23.2% from the same period the year before…
“The decline in new homebuilding is particularly acute for lower-priced homes, due to rising construction and land costs, limited lot availability, and regulatory barriers like minimum lot sizes that restrict entry-level housing production. In 2021, just 24% of new homes… were under 1,800 square feet, compared with 37 percent of new completions in 1999.
“The construction slowdown in 2022 raised concerns about the nation’s large and ongoing housing shortfall… new supply has not kept pace with demand, compressing vacancy rates and limiting the supply of homes for sale. In March 2023, just 970,000 existing homes… were available for purchase… 42% less than in 2019, when supply was already historically low.”
The Urban Institute says, “In January 2024, single-family completions are 53 percent lower than the March 2006 peak of 1.91 million units.”
For low- and moderate-income earners, there was little relief in the rental arena. According to the Harvard study, “…fully 36% of newly completed multifamily units had asking rents of $2,050 or more, while just 5% had asking rents below $1,050, leaving renters with low and moderate incomes to reckon with a stubbornly tight supply of moderate- and lower-priced apartments.”
‘Cost-burdened renters’ have to spend over 30% of their income on rent. ‘Severely cost-burdened renters’ have to spend over 50% of their income. By 2021, 21.6 million renters (49% of all renters) were cost-burdened, with over half of them severely so. On the homeowner front, 19 million were cost-burdened with 8.7 million severely so.
The study points out that these rates are far worse for low-income earners:
- 86% for incomes below $15k.
- 68% for incomes between $15k and $30k.
- 63% for incomes between $30k and $45k.
- 34% for incomes between $45k and $75k.
By 2021, household income remaining after housing costs were covered dropped to just $380 for renters and $680 for homeowners.
The Urban Institute report finds similar data, “even with interest rates slightly down from October 2023, it is more difficult to afford a house now than it was at the peak of the 2005 housing bubble… The median homebuyer in 2023 and so far in 2024 is cost-burdened… lower-income homebuyers are more severely cost-burdened, with the median homebuyer in 2023 and so far in 2024 with an annual income less than $150,000 paying over 40% of their monthly income on debt payments… based on mortgages originated in January 2024, the average [first-time homebuyer] was more likely than an average repeat buyer to take out a smaller loan, have a lower credit score, and have a higher [loan-to-value ratio].”
Shifting Geography for Households
Between the social distancing needs due to the pandemic, the rise in remote work, and the decreased affordability of homes, populations predictably declined in urban areas, especially high-cost ones, while smaller metro areas and rural counties saw population gains. As a result, the report concludes, “…domestic migration has become the largest source of population growth in 20 states [e.g., Texas, Florida, North Carolina, Montana, and Wyoming] and the largest source of population decline in 23 states.”
The Bottom Line
Both the Harvard and Urban Institute studies find that housing affordability has dropped dramatically over the past three years.
As a result, the rate of housing-burdened renters and homeowners increased dramatically, with as many as 86% of families earning under $15k spending over 30% of their income on housing. Even for income levels between $45k and $75k, the same is true for more than one in three families.
The average residual income for renters and homeowners dropped to just $380 and $680, respectively. That’s the amount remaining to cover food, transportation, healthcare, and other costs after covering housing (rent or mortgage P&I).
Along with several pandemic-related factors, this has driven significant population flow from high-cost urban areas and states to lower-cost ones, with 20 states benefitting, especially in the south, and 23 states losing population.
Have a Question to Ask a Financial Advisor?
➡️ Submit your question, and it may be answered by a financial advisor in an upcoming article or in the Expert Answers Forum on Wealthtender.
Additional Find-an-Advisor Resources:
Disclaimer: This article is intended for informational purposes only, and should not be considered financial advice. You should consult a financial professional before making any major financial decisions.

About the Author
Opher Ganel, Ph.D.
My career has had many unpredictable twists and turns. A MSc in theoretical physics, PhD in experimental high-energy physics, postdoc in particle detector R&D, research position in experimental cosmic-ray physics (including a couple of visits to Antarctica), a brief stint at a small engineering services company supporting NASA, followed by starting my own small consulting practice supporting NASA projects and programs. Along the way, I started other micro businesses and helped my wife start and grow her own Marriage and Family Therapy practice. Now, I use all these experiences to also offer financial strategy services to help independent professionals achieve their personal and business finance goals. Connect with me on my own site: OpherGanel.com and/or follow my Medium publication: medium.com/financial-strategy/.
Learn More About Opher
Wealthtender is a trusted, independent financial directory and educational resource governed by our strict Editorial Policy, Integrity Standards, and Terms of Use. While we receive compensation from featured professionals (a natural conflict of interest), we always operate with integrity and transparency to earn your trust. Wealthtender is not a client of these providers. ➡️ Find a Local Advisor | 🎯 Find a Specialist Advisor