
Wealthtender is a trusted, independent financial directory and educational resource governed by our strict Editorial Policy, Integrity Standards, and Terms of Use. While we receive compensation from featured professionals (a natural conflict of interest), we always operate with integrity and transparency to earn your trust. Wealthtender is not a client of these providers. ➡️ Find a Local Advisor | 🎯 Find a Specialist Advisor

If you were born to wealthy parents, reading this article is probably a waste of your time.
If, like almost all of us, you weren’t, read on…
Anyone who’s been reading about wealth knows that rather than income, it’s about net worth – the difference between what you own and what you owe.
Building significant net worth takes a combination of talent, hard work, opportunity (a.k.a. luck), and time. In the following, we’ll see how that last factor, time, affects things for Americans from all walks of life.
The data shown below all comes from a nifty net worth by age calculator at DQYDJ.com.

Americans’ Starting Points Are Far From Equal
I’m sure you won’t be shocked to learn this, but we don’t all get to begin our wealth-accumulation race at a common starting line.
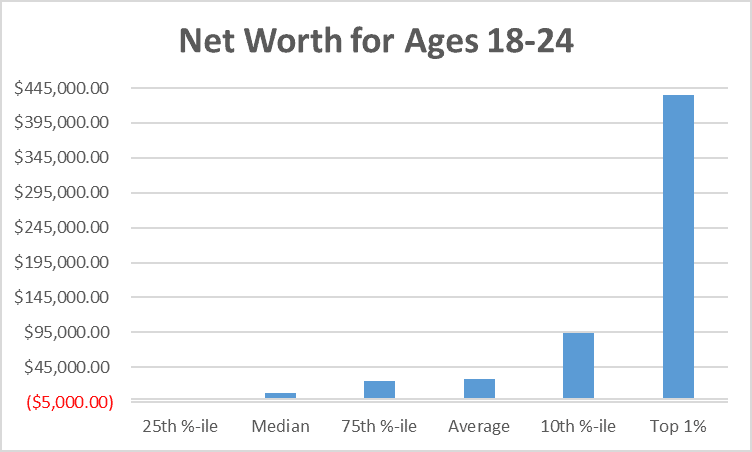
The above graph shows just how unequal our starting points are.
If you’re in the 25th percentile, your starting point is negative – you owe more than you own. Obviously, if you’re in a lower percentile, you start even further in the red.
If you’re in the middle of the pack, your net worth at the start of adulthood is less than $10k.
At the 90th percentile, meaning you’re wealthier than 90% of your age cohort, your starting point is just shy of 6 figures.
However, to make it into the top 1%, you have to have at least $435k! An American in the middle of the pack will never in her life accumulate even 2/3 of what you’re starting off with! That’s called privilege, and except for very rare cases is all a result of being born to the right parents.
How Wealth “Accumulation” Goes for the 25th Percentile
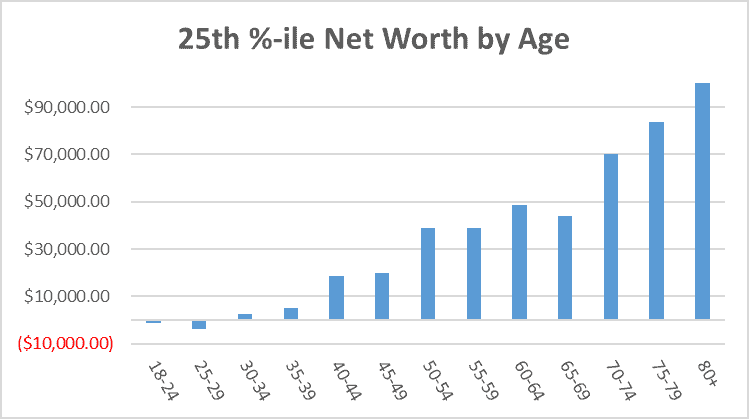
The picture for the 25th percentile is grim.
This group starts with a negative net worth at the start of adulthood and drops even further into debt by the end of their 20s.
They then slowly claw their way out of debt, but never reach $100,000 net worth over a lifetime.
How Wealth Accumulation Goes for the Median, or 50th Percentile
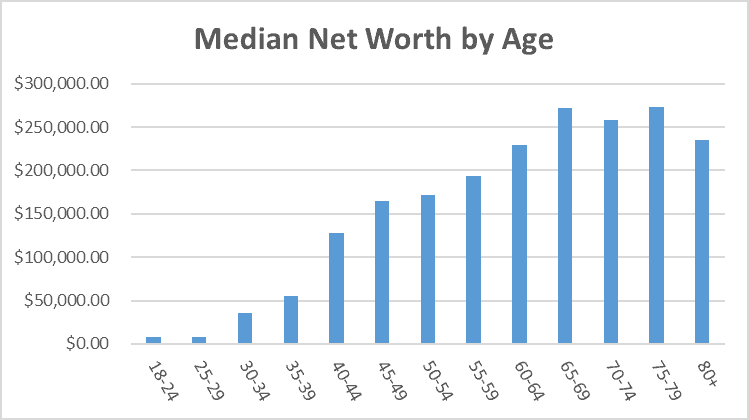
If you’re in the 50th percentile, there are the same number of people above you as below. That’s also known as the median.
Here, your adulthood starts with a few thousand dollars more owned than owed. By the end of your 20s, your net worth declines a bit, but is still above $7000.
You break through the $100,000 barrier in your early 40s.
By retirement age, your wealth nearly peaks at about $270,000. With a few minor ups and downs, it stays above $235,000 into your 80s and beyond (if you live that long).
How Wealth Accumulation Goes for the 75th Percentile
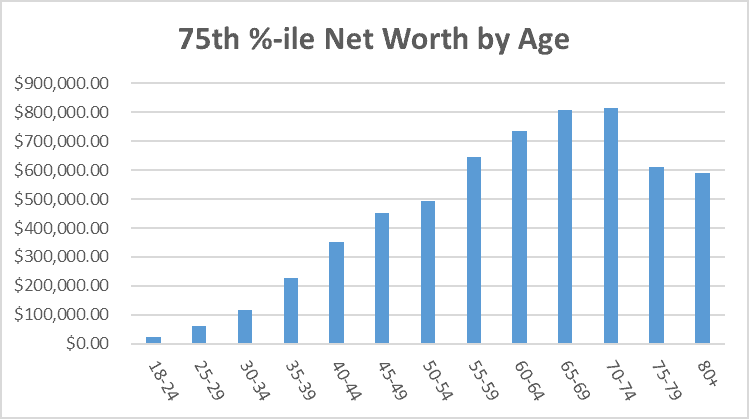
In the 75th percentile, obviously, things are better.
Here, you start adulthood starts with nearly $25,000.
You break through the $100,000 barrier in your early 30s, a decade earlier than the median guys.
By retirement age, your wealth peaks at over $800,000. In your 70s, it drops by about 25% to just over $600,000, with a slight further decline in your 80s.
Actual Wealth Accumulation a la the 90th Percentile
In the 90th percentile, we start seeing actual wealth.
If this includes you, your adulthood starts with nearly $100,000. That’s more than the median guys see until their 40s.
You become a millionaire in your mid 40s.
In your mid to late 50s, you peak at $2.5 million! While your wealth appears to drop 20% in your 60s and another 25% in your mid to late 70s, your net worth never drops below $1.5 million.
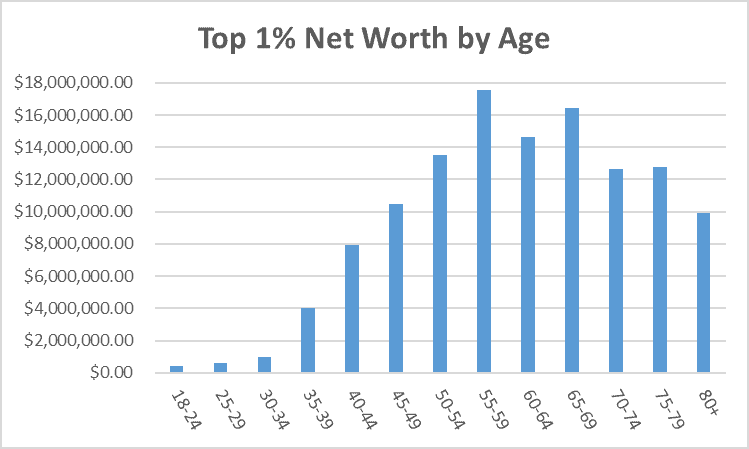
What Real Wealth Looks Like – the Top 1%
In early adulthood, you already have over $400,000. That’s more than most Americans will ever see in their lifetimes. The 75th percentile will be in their mid to late 40s before they reach your starting point. Even the 90th percentile will need over a decade to reach that point.
You become a millionaire in your early 30s.
By your mid-40s you break through the $10 million mark.
You peak in your mid to late 50s around $17.5 million. From that age, your net worth fluctuates, but stays above $10 million, except that in your 80s it might dip ever so slightly below that.
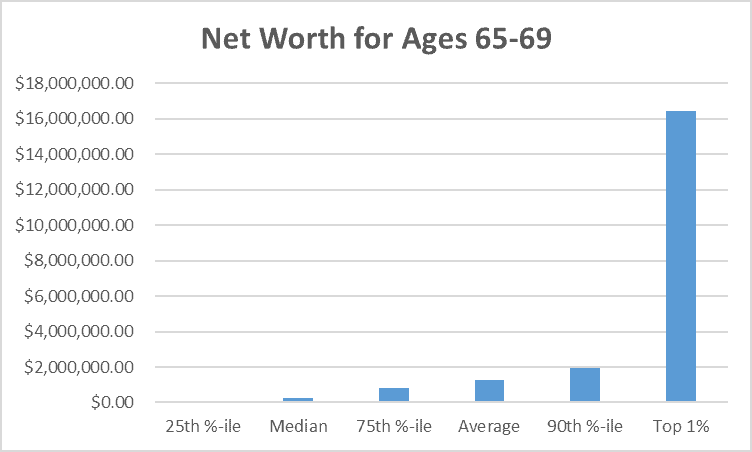
Wealth in Your Mid to Late 60s and What It Means for Your Retirement
Recapping across those groups, here’s what wealth looks like in your mid to late 60s, what most consider standard retirement age.
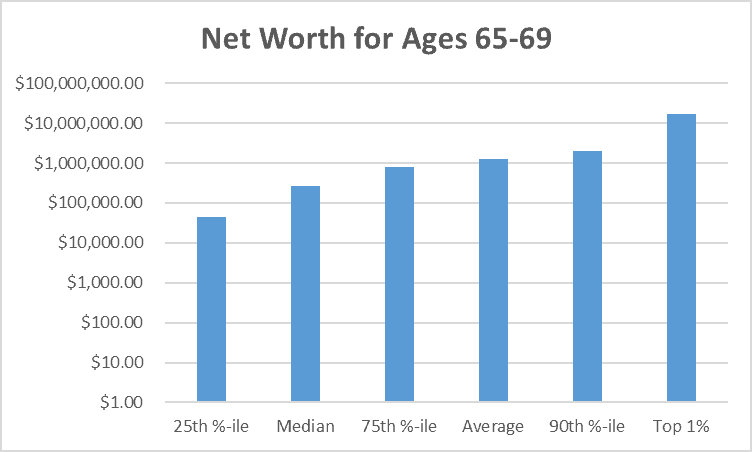
Given the vast discrepancy across groups, here’s what the same data look like on a logarithmic scale, so you can see details for all groups.
The next graph shows what contribution you can expect toward your retirement budget according to the “4% rule.”
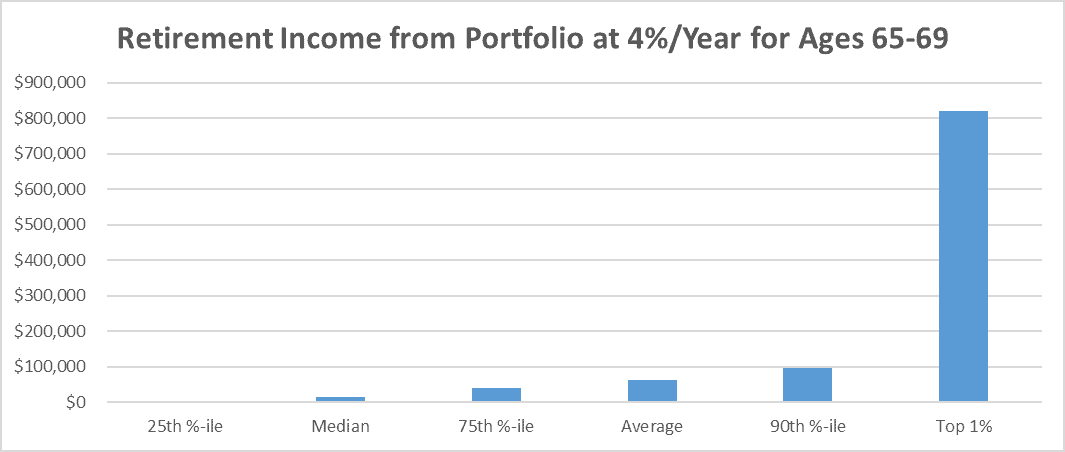
And again with a logarithmic scale to see the details for most people…
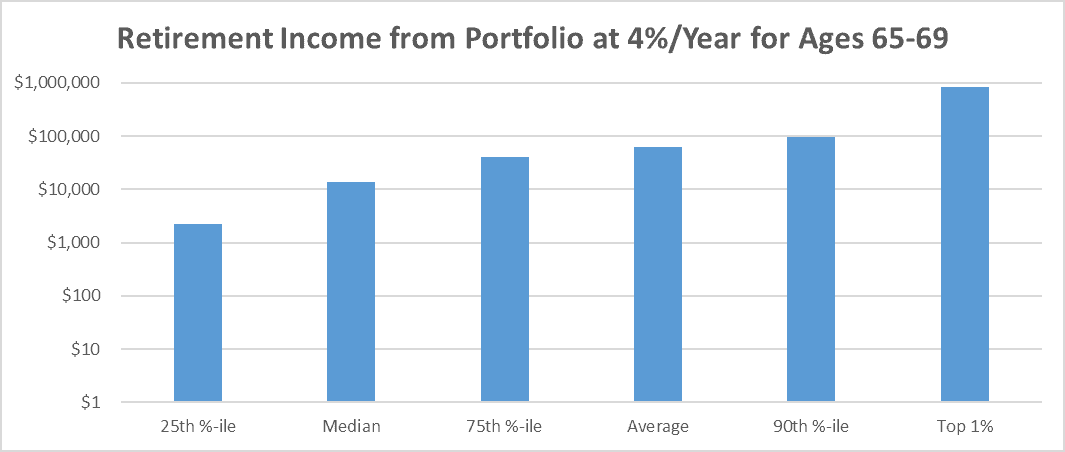
As you can see, the median gets less than $14,000 a year from the net worth they accumulate. That’s probably less than they get from Social Security!
The 75th percentile can get about $40,000 a year, which may allow a plausible retirement when combined with Social Security benefits and some frugality.
The 90th percentile almost hits $100,000 a year. With a boost from Social Security, this allows over $10,000 monthly budget – far from shabby.
The top 1% can live on over $820,000 a year, or $68,000 without much risk of ever dipping into their capital! That means their portfolio throws off enough to let them spend each month the full annual median household income in the US!
Note that one of the bars in each of the above plots is labeled “Average,” which ends up far higher than the Median, somewhere between the 75th and 90th percentiles. That’s because the top 1% has an outsized impact on the average, pulling it much higher than it would have been in a “normal” distribution.
A Caveat About the Above Trends
Note this caveat – I ignore mobility between percentiles. Not because it doesn’t happen – in fact, when I was 30, my then-negative net worth placed me in the 16th percentile, while now, decades later I’m much closer to the top.
However, research such as a 2021 MIT report, “Why Do People Stay Poor?” shows that poverty is “sticky.” To quote, “… we identify a threshold level of initial assets above which households accumulate assets, take on better occupations and grow out of poverty. The reverse happens for those below the threshold…”
Thus, while anecdotal cases such as mine prove that mobility does exist, it’s likely not a major factor.
The Bottom Line
It’s disheartening to see how most Americans never manage to build enough wealth for a decent retirement, and for most, it’s likely not because of poor choices, lack of talent, or laziness. However, it’s important that we look at the data as they are, and learn whatever lessons we can about what we can control in our own lives, so we can work toward better outcomes.
Disclaimer: This article is intended for informational purposes only, and should not be considered financial advice. You should consult a financial professional before making any major financial decisions.

About the Author
Opher Ganel, Ph.D.
My career has had many unpredictable twists and turns. A MSc in theoretical physics, PhD in experimental high-energy physics, postdoc in particle detector R&D, research position in experimental cosmic-ray physics (including a couple of visits to Antarctica), a brief stint at a small engineering services company supporting NASA, followed by starting my own small consulting practice supporting NASA projects and programs. Along the way, I started other micro businesses and helped my wife start and grow her own Marriage and Family Therapy practice. Now, I use all these experiences to also offer financial strategy services to help independent professionals achieve their personal and business finance goals. Connect with me on my own site: OpherGanel.com and/or follow my Medium publication: medium.com/financial-strategy/.
Learn More About Opher
Wealthtender is a trusted, independent financial directory and educational resource governed by our strict Editorial Policy, Integrity Standards, and Terms of Use. While we receive compensation from featured professionals (a natural conflict of interest), we always operate with integrity and transparency to earn your trust. Wealthtender is not a client of these providers. ➡️ Find a Local Advisor | 🎯 Find a Specialist Advisor