

Looking at net worth percentiles and averages by age group.
Admit it!
You can’t resist comparing yourself and your accomplishments to others, especially your peer group.
Right?
I do this, too, on occasion. It’s only human.
Here are several tables and graphs to help you compare. The data are all based on a Fed survey via DQYDJ.com.
First, Defining Families
First off, we want to know what we’re comparing. In this case, it’s household or family net worth.
How are families/households defined here?
According to the Fed, there were 131.3 million families or households in the US as of the most recent survey (2022), which the Fed defined: “… a household unit is divided into a primary economic unit (PEU) — the family — and everyone else in the household. The PEU is intended to be the economically dominant single person or couple (whether married or living together as partners) and all other persons in the household who are financially interdependent with that economically dominant person or couple.”
Net Worth Percentiles by Age
To kick things off, the following table presents net worth percentiles and averages by age group.
The first column shows the age groups, and the second provides the average net worth for each age group.
Next, we see six columns showing the 25th, 50th, 75th, 90th, 95th, and 99th percentiles for each age group. Notice how the average is far higher than the median, which is the 50th percentile (see also the first graph after the table).
For example, if your net worth at age 37 is $900k, you’d be between the 90th percentile ($864.3k) and 95th percentile ($1.48M) and closer to the former than the latter.
| Age | Average | 25% | 50% | 75% | 90% | 95% | Top 1% |
|---|---|---|---|---|---|---|---|
| 18–24 | $112,104 | $88 | $10,222 | $33,898 | $184,516 | $421,700 | $653,224 |
| 25–29 | $120,183 | $3,784 | $31,470 | $130,606 | $296,830 | $410,060 | $2,121,910 |
| 30–34 | $258,075 | $11,016 | $88,631 | $186,140 | $538,750 | $796,256 | $2,636,882 |
| 35–39 | $501,295 | $16,548 | $138,588 | $389,432 | $864,340 | $1,482,170 | $4,741,320 |
| 40–44 | $590,710 | $23,812 | $134,382 | $436,892 | $1,182,580 | $1,971,456 | $7,835,420 |
| 45–49 | $781,936 | $47,668 | $213,586 | $680,298 | $1,428,714 | $2,790,132 | $8,701,500 |
| 50–54 | $1,132,497 | $54,414 | $266,140 | $913,012 | $2,576,540 | $4,419,488 | $13,231,940 |
| 55–59 | $1,441,987 | $84,977 | $321,074 | $1,137,318 | $2,672,160 | $6,049,934 | $15,371,684 |
| 60–64 | $1,675,294 | $80,372 | $392,860 | $1,131,122 | $3,042,280 | $6,366,204 | $17,869,960 |
| 65–69 | $1,836,884 | $68,972 | $393,480 | $1,154,552 | $2,961,060 | $6,865,468 | $22,102,660 |
| 70–74 | $1,714,085 | $124,757 | $438,700 | $1,234,946 | $2,999,396 | $6,197,642 | $18,761,580 |
| 75–79 | $1,629,275 | $89,504 | $338,180 | $991,520 | $2,914,188 | $5,844,534 | $19,868,894 |
| 80+ | $1,611,984 | $95,230 | $327,200 | $944,334 | $2,540,500 | $5,461,280 | $16,229,800 |
Here is the same data in three graphs.
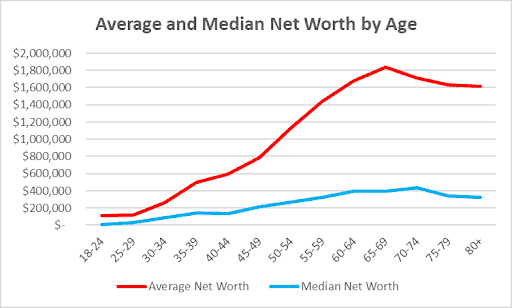
First, we compare the average net worth to the median (50th percentile, where you have more than half the households).
As mentioned above, the average is much higher, because it’s skewed by the immense wealth of the top few percentiles. We also see that the average peaks in one’s late 60s while the median peaks a bit later, in one’s early 70s.
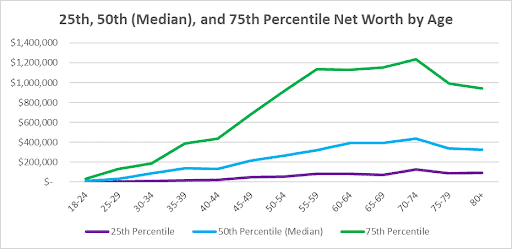
Next, we compare the 25th, 50th, and 75th percentiles. All peak in the early 70s, and the 75th percentile is higher than the 50th by much more than the 50th exceeds the 25th.
This reflects the increasing inequality in our society, where wealth is concentrated near the top so the difference made by each percentage point increases as the percentile position goes higher.
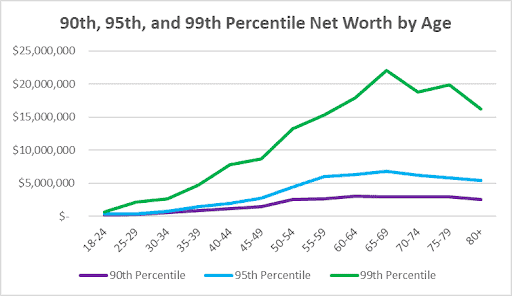
Finally, we compare the 90th, 95th, and 99th percentile (that last is the infamous “1-percenters”).
Interestingly, the 90th percentile is pretty flat, around $2.5M to $3M, from one’s early 50s to one’s 80s.
The 95th is slightly less flat, with a peak slightly under $7M in one’s late 60s; while the 99th percentile rises sharply with age until peaking over $22M in one’s late 60s, from which point it mostly drops.
Investable Net Worth Percentiles by Age
Next, we repeat the whole sequence but now exclude home equity from the numbers.
Strictly speaking, this isn’t as viable a measure of wealth, but it helps assess the investment returns you might expect from your portfolio. That’s because your home equity doesn’t typically provide cash flow.
| Age | Average | 25% | 50% | 75% | 90% | 95% | Top 1% |
|---|---|---|---|---|---|---|---|
| 18–24 | $83,365 | $74 | $9,774 | $22,616 | $74,184 | $183,540 | $553,224 |
| 25–29 | $84,699 | $1,218 | $19,270 | $71,680 | $191,604 | $300,730 | $1,877,120 |
| 30–34 | $182,198 | $2,530 | $36,178 | $100,248 | $291,262 | $579,136 | $2,403,902 |
| 35–39 | $380,972 | $8,070 | $43,416 | $208,930 | $645,230 | $1,199,640 | $4,556,660 |
| 40–44 | $436,408 | $8,699 | $57,668 | $245,586 | $818,830 | $1,506,282 | $6,702,740 |
| 45–49 | $575,097 | $15,144 | $92,370 | $408,002 | $1,006,852 | $2,002,670 | $7,661,420 |
| 50–54 | $861,235 | $13,406 | $94,923 | $531,484 | $1,971,490 | $3,327,520 | $11,897,166 |
| 55–59 | $1,148,392 | $15,108 | $131,460 | $709,824 | $2,013,308 | $4,945,610 | $14,104,130 |
| 60–64 | $1,364,736 | $22,343 | $186,450 | $751,586 | $2,489,080 | $4,988,724 | $15,620,474 |
| 65–69 | $1,512,595 | $11,780 | $132,290 | $784,100 | $2,302,160 | $5,650,770 | $18,992,040 |
| 70–74 | $1,380,172 | $40,480 | $237,692 | $770,944 | $2,452,560 | $5,036,686 | $16,459,620 |
| 75–79 | $1,308,408 | $12,818 | $112,106 | $527,860 | $2,384,806 | $4,975,080 | $17,971,150 |
| 80+ | $1,284,384 | $17,284 | $88,049 | $524,526 | $1,860,666 | $4,136,000 | $15,590,600 |
Here, we see a similar pattern, with some striking differences.
- For the 25th percentile, total net worth increases from next to nothing for ages 18–24 up to $125k by the early 70s, whereas investable net worth peaks at a far lower $28k.
- For the 50th percentile (median), there’s a similar pattern, though investable net worth peaks at $238k, about half the $439k total net worth in the early 70s age group.
- As you go up to the 75th percentile and higher, home equity continues to drop in relative importance (more on that later on).
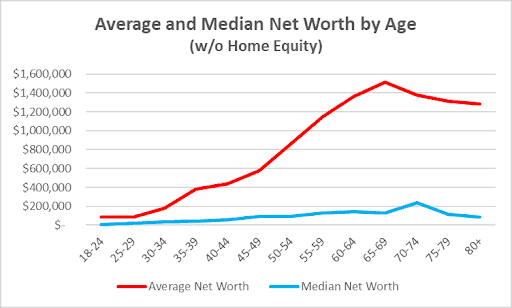
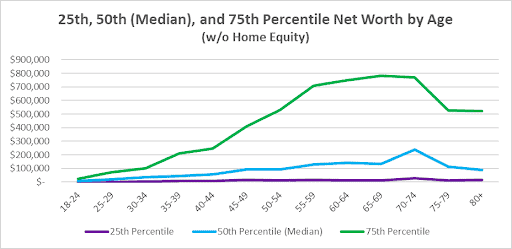
Next, we have the same three graphs as before but this time excluding home equity.
As the first graph of these three graphs shows, the average investable net worth is again far higher than the median, with the two peaking at the same age groups as total net worth.
The second graph shows that, if anything, investable net worth jumps from the 50th to the 75th percentile more than from the 25th to the 50th even more than total net worth does.
The 75th percentile peaks at $784k for ages 65 to 69, a little earlier than total net worth peaks.
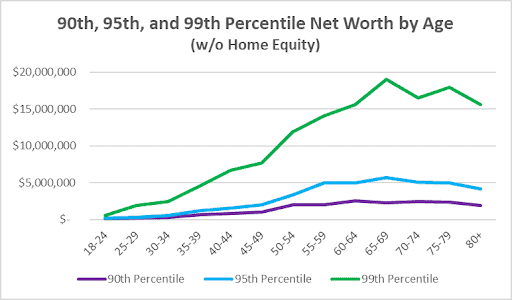
For the 90th, 95th, and 99th percentiles, investable net worth behaves quite similarly to total net worth. Considering how small a part home equity plays in wealth at these levels, this isn’t surprising.
Home Equity for Different Net Worth Percentiles by Age
Finally, we can look at the difference between the data in the first and second tables to estimate the average home equity held by different net worth percentiles by age group.
| Age | Average | 25% | 50% | 75% | 90% | 95% | Top 1% |
|---|---|---|---|---|---|---|---|
| 18–24 | $28,739 | $14 | $448 | $11,282 | $110,332 | $238,160 | $100,000 |
| 25–29 | $35,484 | $2,566 | $12,200 | $58,926 | $105,226 | $109,330 | $244,790 |
| 30–34 | $75,877 | $8,486 | $52,453 | $85,892 | $247,488 | $217,120 | $232,980 |
| 35–39 | $120,323 | $8,478 | $95,172 | $180,502 | $219,020 | $282,530 | $184,660 |
| 40–44 | $154,302 | $15,113 | $76,714 | $191,306 | $363,750 | $465,174 | $1,132,580 |
| 45–49 | $206,839 | $32,524 | $121,216 | $225,972 | $427,865 | $787,462 | $1,040,000 |
| 50–54 | $271,262 | $41,008 | $171,217 | $381,528 | $605,805 | $1,091,968 | $1,334,774 |
| 55–59 | $293,595 | $69,869 | $189,614 | $427,494 | $658,800 | $1,104,324 | $1,317,584 |
| 60–64 | $310,558 | $68,170 | $249,220 | $379,536 | $532,725 | $1,377,480 | $2,249,680 |
| 65–69 | $324,289 | $57,192 | $261,190 | $370,452 | $658,900 | $1,214,698 | $3,110,620 |
| 70–74 | $333,913 | $96,317 | $201,008 | $464,002 | $542,876 | $1,160,956 | $2,249,000 |
| 75–79 | $320,867 | $76,686 | $226,074 | $463,660 | $529,360 | $869,454 | $1,897,744 |
| 80+ | $327,600 | $77,946 | $239,151 | $419,808 | $679,834 | $1,325,280 | $639,200 |
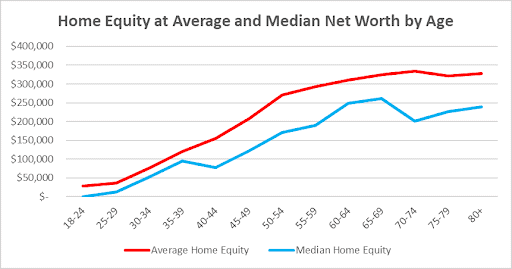
We see several patterns here.
- The average and median home equity levels are far closer to each other across all age groups than is the case for net worth.
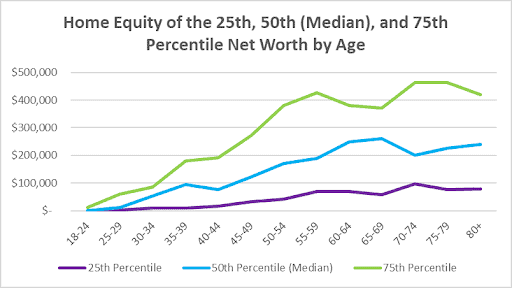
- For the 25th percentile, home equity starts taking off mostly after age 40, roughly doubling from the late 30s to the early 40s and continuing to go up by $8k-$9k every five years until the early 60s. There’s an odd drop in the second half of the 60s before a jump of over 50% into the early 70s followed by a drop of ~20% into the late 70s and beyond. These odd ups and downs could be due to large variances between the relatively small sample of older poor people (the life expectancy of the wealthy can exceed that of the poor by more than a decade).
- For the median, home equity starts climbing earlier, in the early 30s, where it more than quadruples relative to the late 20s. It then mostly rises until the late 60s, from which it mostly falls. However, the differences from the late 60s and on are under 25% at most. This could again be the result of life expectancy being somewhat lower for this economic stratum than those above it.
- The home equity of the 75th net worth percentile starts climbing earlier yet, in the late 20s, more than quintupling from the teens and early 20s. It then mostly climbs until the early 50s. From there, it dips somewhat lower for the following 10 years, before climbing again, peaking in the 70s. This pattern may be related to having college-age kids and possibly using home equity to help finance their education.
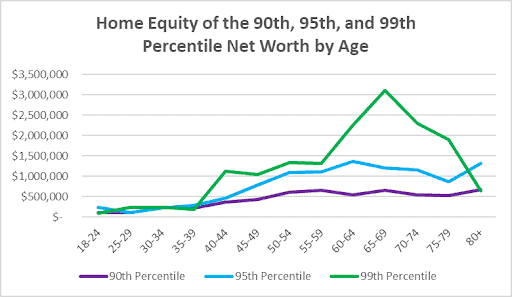
- For the 90th, 95th, and 99th net worth percentiles, home equity is already $100k or higher for late teens and early 20s. For the 90th and 95th percentiles, home equity mostly rises with age, with some relatively small fluctuations. For both the 90th and 95th percentiles, the highest home equity is reached for ages 80 plus. For the top 1% however, home equity peaks sharply at over $3M in the late 60s before dropping nearly five-fold by the late 80s. This could be due to the very wealthy significantly downsizing their homes in their later years.
You can see all these patterns visually in the next three graphs.
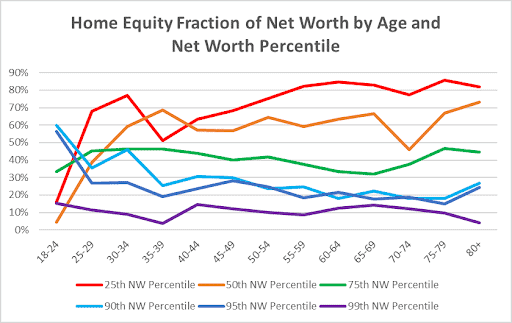
Home Equity as Fraction of Net Worth
The final table shows home equity for various net worth percentiles as a fraction of net worth rather than in absolute dollar terms.
Here, we see the following patterns.
- Home equity is more than half the net worth at the 25th percentile, reaching as high as 86% for the late 70s age group.
- For the median net worth, home equity is again half or more of net worth for most age groups above age 30, peaking at a somewhat lower 73% for ages 80 and over.
- For the 75th percentile, home equity typically runs from a third of net worth to slightly less than half, peaking at 47% in the late 70s.
- Those in the 90th percentile have home equity starting at 60% in their late teens and early 20s before dropping to a range of 18% to 31% for ages 40 and over, with the 31% peak in the early 40s.
- For the 95th percentile we see a similar pattern, with 56% for the youngest age group, dropping to a range of 15% to 28% from age 25 and up, with the 28% peak in the late 40s.
- Home equity plays a small role in the net worth of the top 1%, ranging from a high of 15% for the youngest age group down to as low as 4%(!) for those in their late 30s and again for ages 80 and up.
| Age | Average | 25% | 50% | 75% | 90% | 95% | Top 1% |
|---|---|---|---|---|---|---|---|
| 18–24 | 26% | 16% | 4% | 33% | 60% | 56% | 15% |
| 25–29 | 30% | 68% | 39% | 45% | 35% | 27% | 12% |
| 30–34 | 29% | 77% | 59% | 46% | 46% | 27% | 9% |
| 35–39 | 24% | 51% | 69% | 46% | 25% | 19% | 4% |
| 40–44 | 26% | 63% | 57% | 44% | 31% | 24% | 14% |
| 45–49 | 26% | 68% | 57% | 40% | 30% | 23% | 12% |
| 50–54 | 24% | 75% | 64% | 42% | 23% | 25% | 10% |
| 55–59 | 20% | 82% | 59% | 36% | 25% | 22% | 9% |
| 60–64 | 19% | 85% | 63% | 34% | 23% | 18% | 13% |
| 65–69 | 18% | 83% | 66% | 32% | 22% | 18% | 14% |
| 70–74 | 18% | 77% | 46% | 33% | 18% | 17% | 12% |
| 75–79 | 20% | 86% | 67% | 47% | 18% | 15% | 10% |
| 80+ | 20% | 82% | 73% | 44% | 27% | 24% | 4% |
The last graph, below, shows this picture visually, where home equity plays a smaller and smaller role in net worth as one’s wealth grows. It also shows how home equity percentage peaks move from older to younger as wealth increases.
The Bottom Line
The above shows how total and investable net worth varies by age for various net worth percentiles. It also shows the impact of home equity as part of one’s net worth for those net worth percentiles for the different age groups.
Using the tables and graphs, you can compare your numbers to the overall population, to see where you come out in the wealth distribution. Depending on your perspective, this can lead to despair, complacency, or ambition. Of the three, I recommend that last…
As Omar Morillo, CFP ChFC AIF, Founder of Imperio Wealth Advisors says, “Comparing net worth, especially with one’s age cohort, can be helpful and counterproductive. On the positive side, such comparisons can provide a benchmark, motivating individuals to save and invest more wisely to achieve financial security. It can foster competition, leading to better financial decisions and habits. However, this practice can also be counterproductive, leading to feelings of inadequacy or stress if one’s financial situation lags behind peers. It might encourage unhealthy financial behaviors, such as excessive risk-taking or overspending, in an attempt to ‘keep up.’ For example, after comparing their net worth with friends, I had a client who invested in high-risk ventures to boost their wealth, only to face significant losses quickly. Individuals must focus on personal financial goals tailored to their circumstances rather than purely on comparison. A balanced approach, using comparisons as a tool for insight rather than a definitive measure of success, can help readers make informed decisions while maintaining financial well-being.”
Carman Kubanda, CFP®, ChFC®, Financial Planner at Innovative Wealth Building mostly agrees, “I don’t think comparing net worth is particularly useful. A better approach is focusing on your own situation and financial goals with real financial planning to ensure you make the right choices to accomplish those goals. However, in certain cases, comparing net worth may help encourage financial discipline or spur on change if lagging behind peers.”
Zack Swad, CFP®, CWS®, RLP®, BFA™, AWMA®, AAMS®, President of Swad Wealth Management, LLC on the other hand, falls squarely on the side of comparisons being mostly harmful, saying, “While comparing your net worth to peers may be entertaining (or disappointing), it usually isn’t very useful. Your lifestyle may be drastically different than the average and therefore your needs may be much higher or lower. People who are interested in figuring out if they are on track should start by figuring out what they need in their lives now and into the future. Then, develop good habits and make progress toward their goals. As Theodore Roosevelt once said, ‘Comparison is the thief of joy.’”
If you do choose to view wealth accumulation as a competition, it’s best to view it as a competition between your present and past selves rather than between you and everyone else.
Disclaimer: This article is intended for informational purposes only, and should not be considered financial advice. You should consult a financial professional before making any major financial decisions.
Find Retirement Financial Advisors on Wealthtender
📍 Click on a pin in the map view below for a preview of financial advisors who can help you reach your money goals and enjoy a comfortable retirement with a personalized plan. Or choose the grid view to search our directory of financial advisors with additional filtering options.
📍Double-click or pinch pins to view more.


Do you have questions about your financial future? Find a financial advisor who can help you enjoy life with less money stress by visiting Wealthtender’s advisor directory.
Whether you’re looking for a specialist advisor who can meet with you online, or you prefer to find a nearby financial planner, you deserve to work with a professional who understands your unique circumstances.
Have a question to ask a financial advisor? Submit your question and it may be answered by a Wealthtender community financial advisor in an upcoming article.
–
Do you already work with a financial advisor? You could earn a $50 Amazon Gift Card in less than 5 minutes. Learn more and view terms.
This article originally appeared on Wealthtender. To make Wealthtender free for our readers, we earn money from advertisers, including financial professionals and firms that pay to be featured. This creates a natural conflict of interest when we favor their promotion over others. Wealthtender is not a client of these financial services providers.

About the Author
Opher Ganel, Ph.D.
My career has had many unpredictable twists and turns. A MSc in theoretical physics, PhD in experimental high-energy physics, postdoc in particle detector R&D, research position in experimental cosmic-ray physics (including a couple of visits to Antarctica), a brief stint at a small engineering services company supporting NASA, followed by starting my own small consulting practice supporting NASA projects and programs. Along the way, I started other micro businesses and helped my wife start and grow her own Marriage and Family Therapy practice. Now, I use all these experiences to also offer financial strategy services to help independent professionals achieve their personal and business finance goals. Connect with me on my own site: OpherGanel.com and/or follow my Medium publication: medium.com/financial-strategy/.
Learn More About Opher